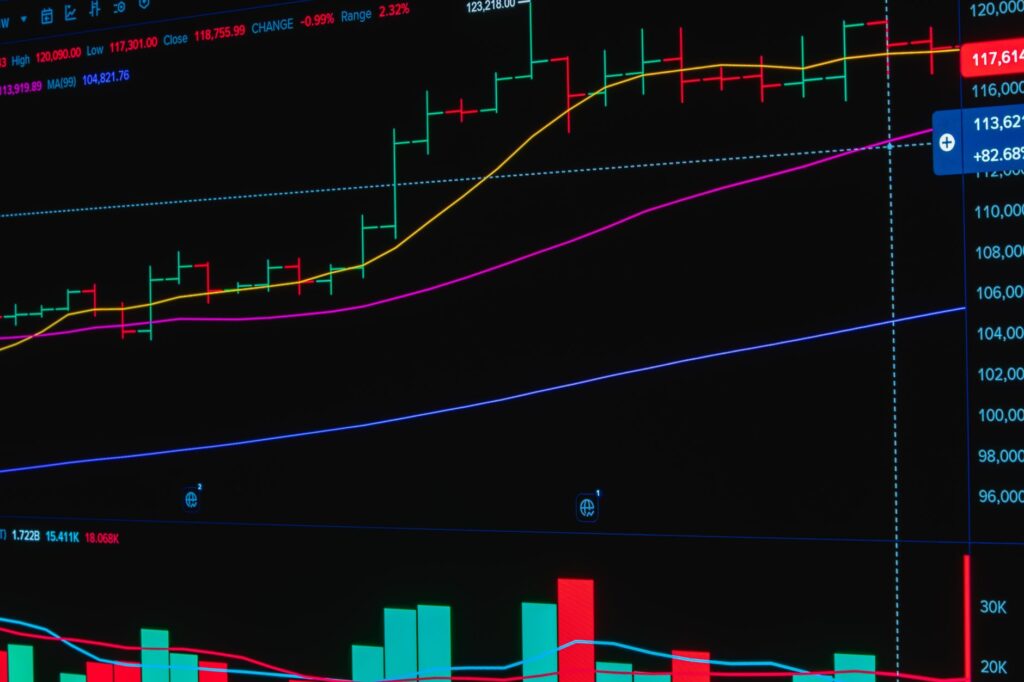

The 200 Day Moving Average Explained
When evaluating the long term direction of the equity markets, financial professionals frequently monitor specific technical indicators. One of the most widely followed metrics by market participants is the two hundred day simple moving average. This indicator smooths out daily price fluctuations to provide a clearer view of the prevailing market trajectory over an extended period.
Market analysis traditionally views any equity trading above its long term average as being in a positive trend. Conversely, prices sustained below this benchmark often signal caution or a persistent downward phase. Identifying when shares manage to surpass this significant threshold is a common strategy for finding potential opportunities.
Significance of the Long Term Trendline
Moving averages serve as dynamic levels of support and resistance. As equities fluctuate throughout trading sessions, institutional and retail investors watch these mathematical boundaries closely. Crossing above the average line often indicates a shift in market sentiment from bearish or neutral to bullish.
Traders and portfolio managers look for sustained movement above this critical threshold as confirmation of underlying strength. When an asset successfully breaches this level on daily charts, it frequently triggers algorithmic buying and renewed interest from momentum investors.
Evaluating Market Breakouts
A breakout occurs when an asset price moves outside a defined support or resistance level with increased volume. When this price action involves the long term moving average, market participants take notice. It suggests that the prevailing forces driving the asset have overcome historical selling pressure.
However, analysts always recommend examining broader market conditions alongside technical indicators. Relying solely on a single moving average can sometimes lead to false signals, particularly during periods of high market volatility or sideways consolidation.
Integrating Technical Indicators into Strategy
Successful wealth management requires a comprehensive approach that combines technical indicators with fundamental analysis. While the two hundred day metric provides valuable insight regarding momentum, it should form just one component of a broader research process.
Investors must also consider company financial health, economic indicators, and sector performance before executing trades. By maintaining a disciplined strategy, market participants can better navigate price movements and manage potential risks effectively.