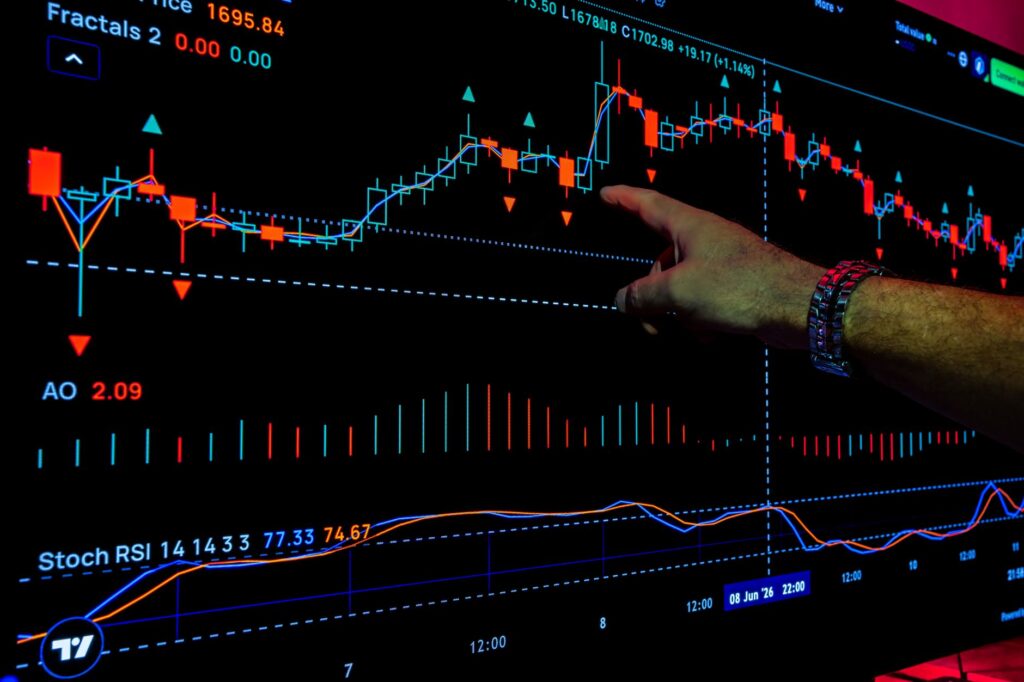

Understanding Momentum Indicators in Stock Trading
Financial markets move through continuous cycles of momentum and consolidation. For investors and traders alike, identifying the exact moment when an asset transitions from a sluggish phase into a strong upward trajectory is a critical skill. Various technical indicators help market participants decode these movements. Among the most widely relied upon tools is the Relative Strength Index. This indicator measures the speed and change of price movements, offering valuable clues about underlying market strength.
Analyzing the Relative Strength Index Thresholds
The Relative Strength Index operates on a scale ranging from zero to one00. Traditionally, readings above seventy indicate that an asset might be overbought, while readings below thirty suggest oversold conditions. However, the midpoint of the indicator holds profound significance for momentum traders. When the Relative Strength Index crosses above the fifty threshold from a lower level, it often signals a bullish shift in market sentiment. This crossover indicates that buying pressure is actively overtaking selling pressure, setting the stage for potential continuation of the upward price trend.
Recent Market Activity in the Broader Index
Recent scanning data from StockEdge highlighted an intriguing development within the broader market. Specifically, four prominent equities included in the Nifty500 index demonstrated notable price appreciation. Each of these equities gained more than eight percent during a single trading session on November fifth. Concurrently, their respective Relative Strength Index metrics crossed decisively above the crucial fifty level from underneath. This technical development points toward a strengthening momentum profile for these specific companies, catching the attention of technical analysts.
Spotlight on Authum Investment and Infrastructure
Leading the group of highlighted equities is Authum Investment and Infrastructure. The company experienced a significant surge in its share price during the session, registering gains exceeding eight percent alongside the broader market cohort. The accompanying technical shift, with the Relative Strength Index moving past the fifty mark, suggests that buyers are stepping in with renewed conviction. Market observers often view such synchronized price appreciation and momentum indicator confirmation as a healthy sign of institutional accumulation or heightened trading interest.
Broader Implications for Market Participants
Technical scans that combine price performance with momentum indicators serve as valuable screening filters for active market participants. While a single day of strong performance does not guarantee future results, crossing above key technical thresholds provides a structured starting point for deeper research. Traders looking for emerging opportunities frequently monitor these specific transitions to identify assets that possess both relative strength and accelerating price momentum within established market indices.
Conclusion on Technical Monitoring
Navigating the complexities of equity markets requires a balanced approach that incorporates both price action and technical indicators. The recent movement observed in Authum Investment and Infrastructure, alongside three other Nifty500 constituents, underscores the importance of tracking momentum shifts. As these assets cross key indicator thresholds while delivering solid single-day gains, they offer clear examples of how technical scans continue to assist market participants in spotting changing momentum trends.