
Understanding Market Trends Through Technical Indicators
Navigating the financial markets requires a solid grasp of technical indicators that help market participants gauge the direction of an equity asset. Among the various tools available to traders and long-term investors, the two hundred day moving average holds a prominent position. This indicator serves as a foundational baseline for evaluating the macro movement of a security over an extended period.
What Is the Two Hundred Day Moving Average
The two hundred day moving average, commonly referred to as the DMA, calculates the average closing price of a specific equity over the preceding two hundred trading days. Because it smooths out daily price volatility, it offers a clearer picture of the prevailing direction. Market participants frequently monitor this metric to distinguish between normal short-term market noise and significant shifts in the underlying trend of a company shares.
Interpreting Price Position Relative to the Average
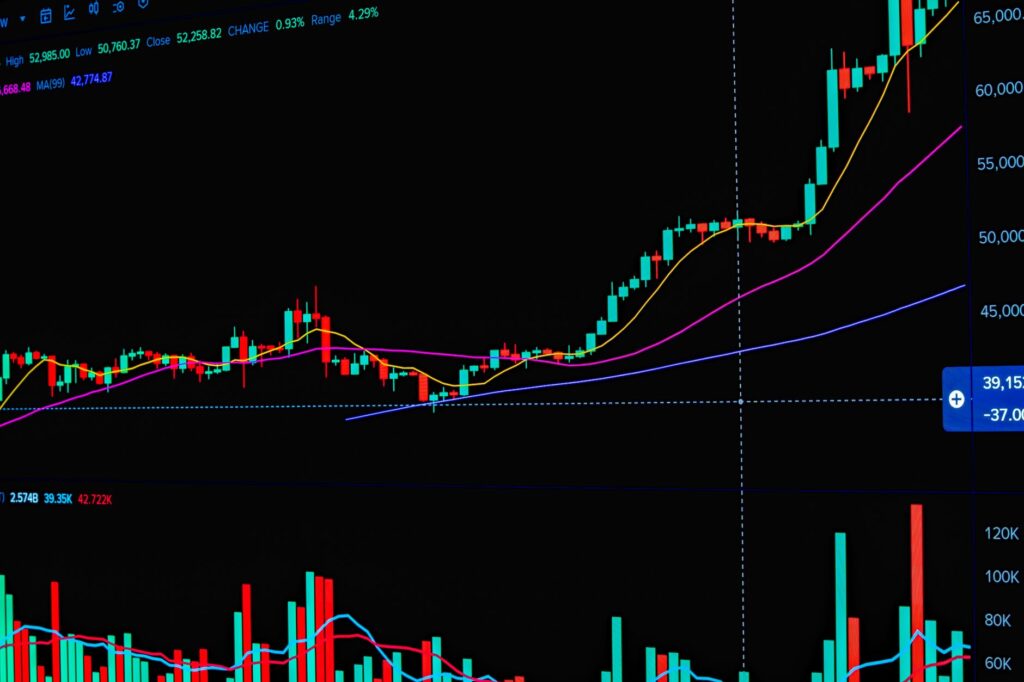
When evaluating a chart, the relationship between the current share price and the moving average is crucial. Generally speaking, market analysts view an equity as being in a broad upward trend when it trades consistently above its two hundred day moving average. Conversely, trading below this threshold often signals a more cautious environment or a prevailing downward trend. Because of this binary interpretation, crossing above this key benchmark is often watched closely by active market participants.
Significance for Traders and Investors
Both short-term traders and long-term institutional investors incorporate this metric into their analytical routines. For momentum traders, a cross above the major moving average can signal a potential shift in market sentiment and the beginning of a sustained bullish phase. Long-term investors often use it as a filter to ensure they allocate capital only to assets that exhibit fundamental strength and upward momentum within the broader economic landscape.
Conclusion on Technical Analysis
While technical indicators should ideally be used in conjunction with fundamental research and robust risk management strategies, the two hundred day moving average remains an enduring staple in finance. By keeping an eye on how equities interact with this significant benchmark, market participants can better navigate changing conditions and make informed decisions regarding their portfolios.