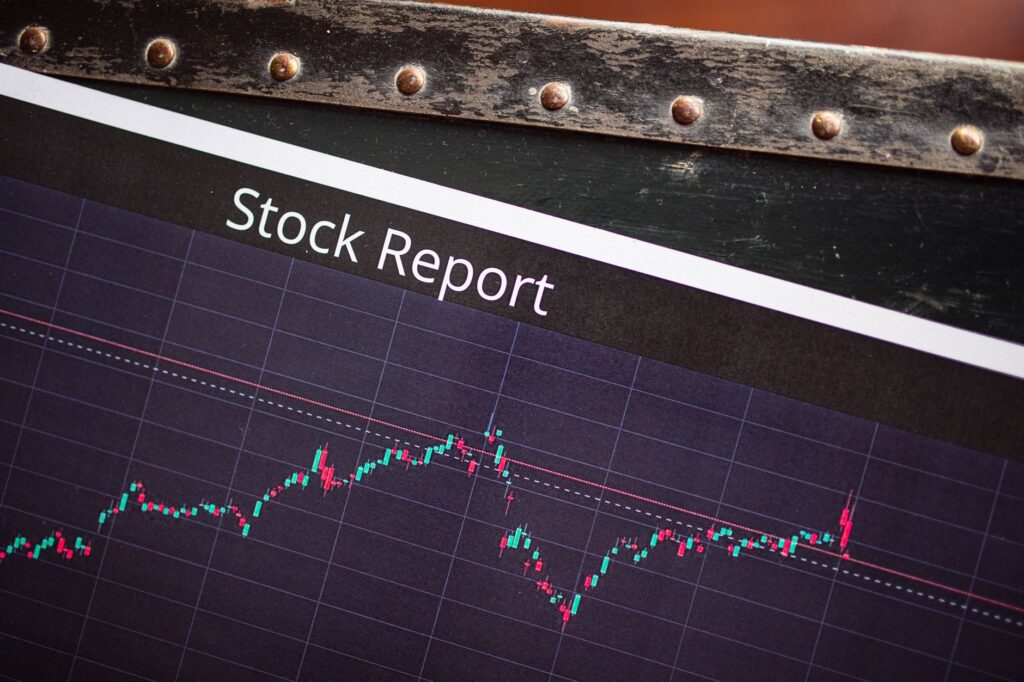

Understanding Market Momentum Indicators
Financial markets constantly provide signals to observant market participants through price action and technical formations. Among the various technical analysis tools available, candlestick patterns remain a foundational method for gauging market sentiment. On a specific trading session in early September, market scanners identified distinct bullish momentum across select equities within the broader market index. These technical developments drew the attention of analysts monitoring market breadth and potential trend reversals or continuations.
Decoding the White Marubozu Formation
The specific technical formation observed across these equities is known as the White Marubozu candlestick pattern. In technical analysis, a Marubozu candle is characterized by the absence of upper and lower shadows, meaning the asset opened at its lowest price and closed at its highest price during the trading period. When this pattern appears in a bullish context, it signifies that buyers maintained absolute control from the opening bell to the closing trade. This sustained accumulation reflects high conviction among market participants and often precedes further upward price movement.
Four Nifty500 Equities Flashing Bullish Signals
The recent trading session highlighted four distinct companies within the Nifty500 universe exhibiting this strong buying pattern. Among the notable names highlighted by technical indicators was Finolex Cables, a prominent player in the electrical and telecommunication cable sector. Alongside this company, three other constituents of the broader index also printed identical bullish formations. This synchronized price action across multiple counters suggests that buying interest was not isolated to a single company but rather reflected broader sector or market accumulation by institutional or retail capital.
Analyzing Market Implications and Next Steps
While technical patterns provide valuable insights into buyer and seller dynamics, market participants generally approach such signals with a balanced perspective. A White Marubozu pattern indicates strong demand during a single session, but sustainable upward trends require confirmation through subsequent price action and volume analysis. Traders and investors monitoring these developments typically look at broader market trends, support levels, and macroeconomic factors before making allocation decisions. As these four Nifty500 equities continue to navigate their respective trading ranges, market observers will closely monitor whether the initial bullish momentum translates into a sustained market uptrend.